How to write a visualization blog for the China Data Lab
Authors
- need to be a real person and their voice, conveying attitude, personality, and character
- be prepared to talk about your research in laymen’s terms—don’t assume the reader is as familiar with this these topics as you are
- should link to a bio*
- bio should list all past blogs
- *Note: you list a bio on one blog post, but not on the other. Just be consistent so that the reader sees the same layout for your blogs.
Titles
- they are what sells the content – (think why would should anyone read this?)
- sets clear expectations for your readers – what they will discover
- make your title pop (a wow factor)
- keep it short and approximately 8-12 words
- ideally under 70 characters so it doesn’t get cut off in search engine results
- can pose a question or state a fact
Length and Structure
- shorter is better (online readers tend to have short attention spans)
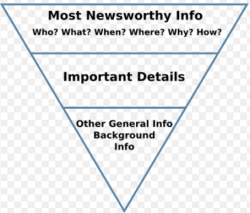
- write in “pyramid style,” put the most important content at the top (see two examples below for further detail)
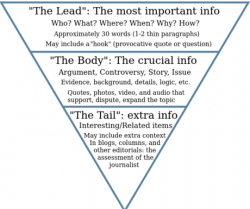
- use the opening sentence (known-as the lead) to grab the attention of the reader…this sentence should take you the most effort to create
- try to keep an average length of 300-600 words
- if a posts is long (over a 1,000 words), break into subheaders for the reader
- keep paragraphs short (easy to scan)
- write short sentences (easy to read)
- hyperlink to details without delving too much (such as papers or data)
- if highly technical, give background for the average reader
Visuals
- find a strong image to set the stage for your blog post
- source your items
- Note: creating interactive graphics and maps are key for your posts, but think about a photo in the beginning to catch the reader’s eye.